Bitcoin vs. Birkin: Speculation, Status, and Very Different Kinds of Scarcity
One is code. One is calfskin. Both became cultural symbols of scarcity and status.
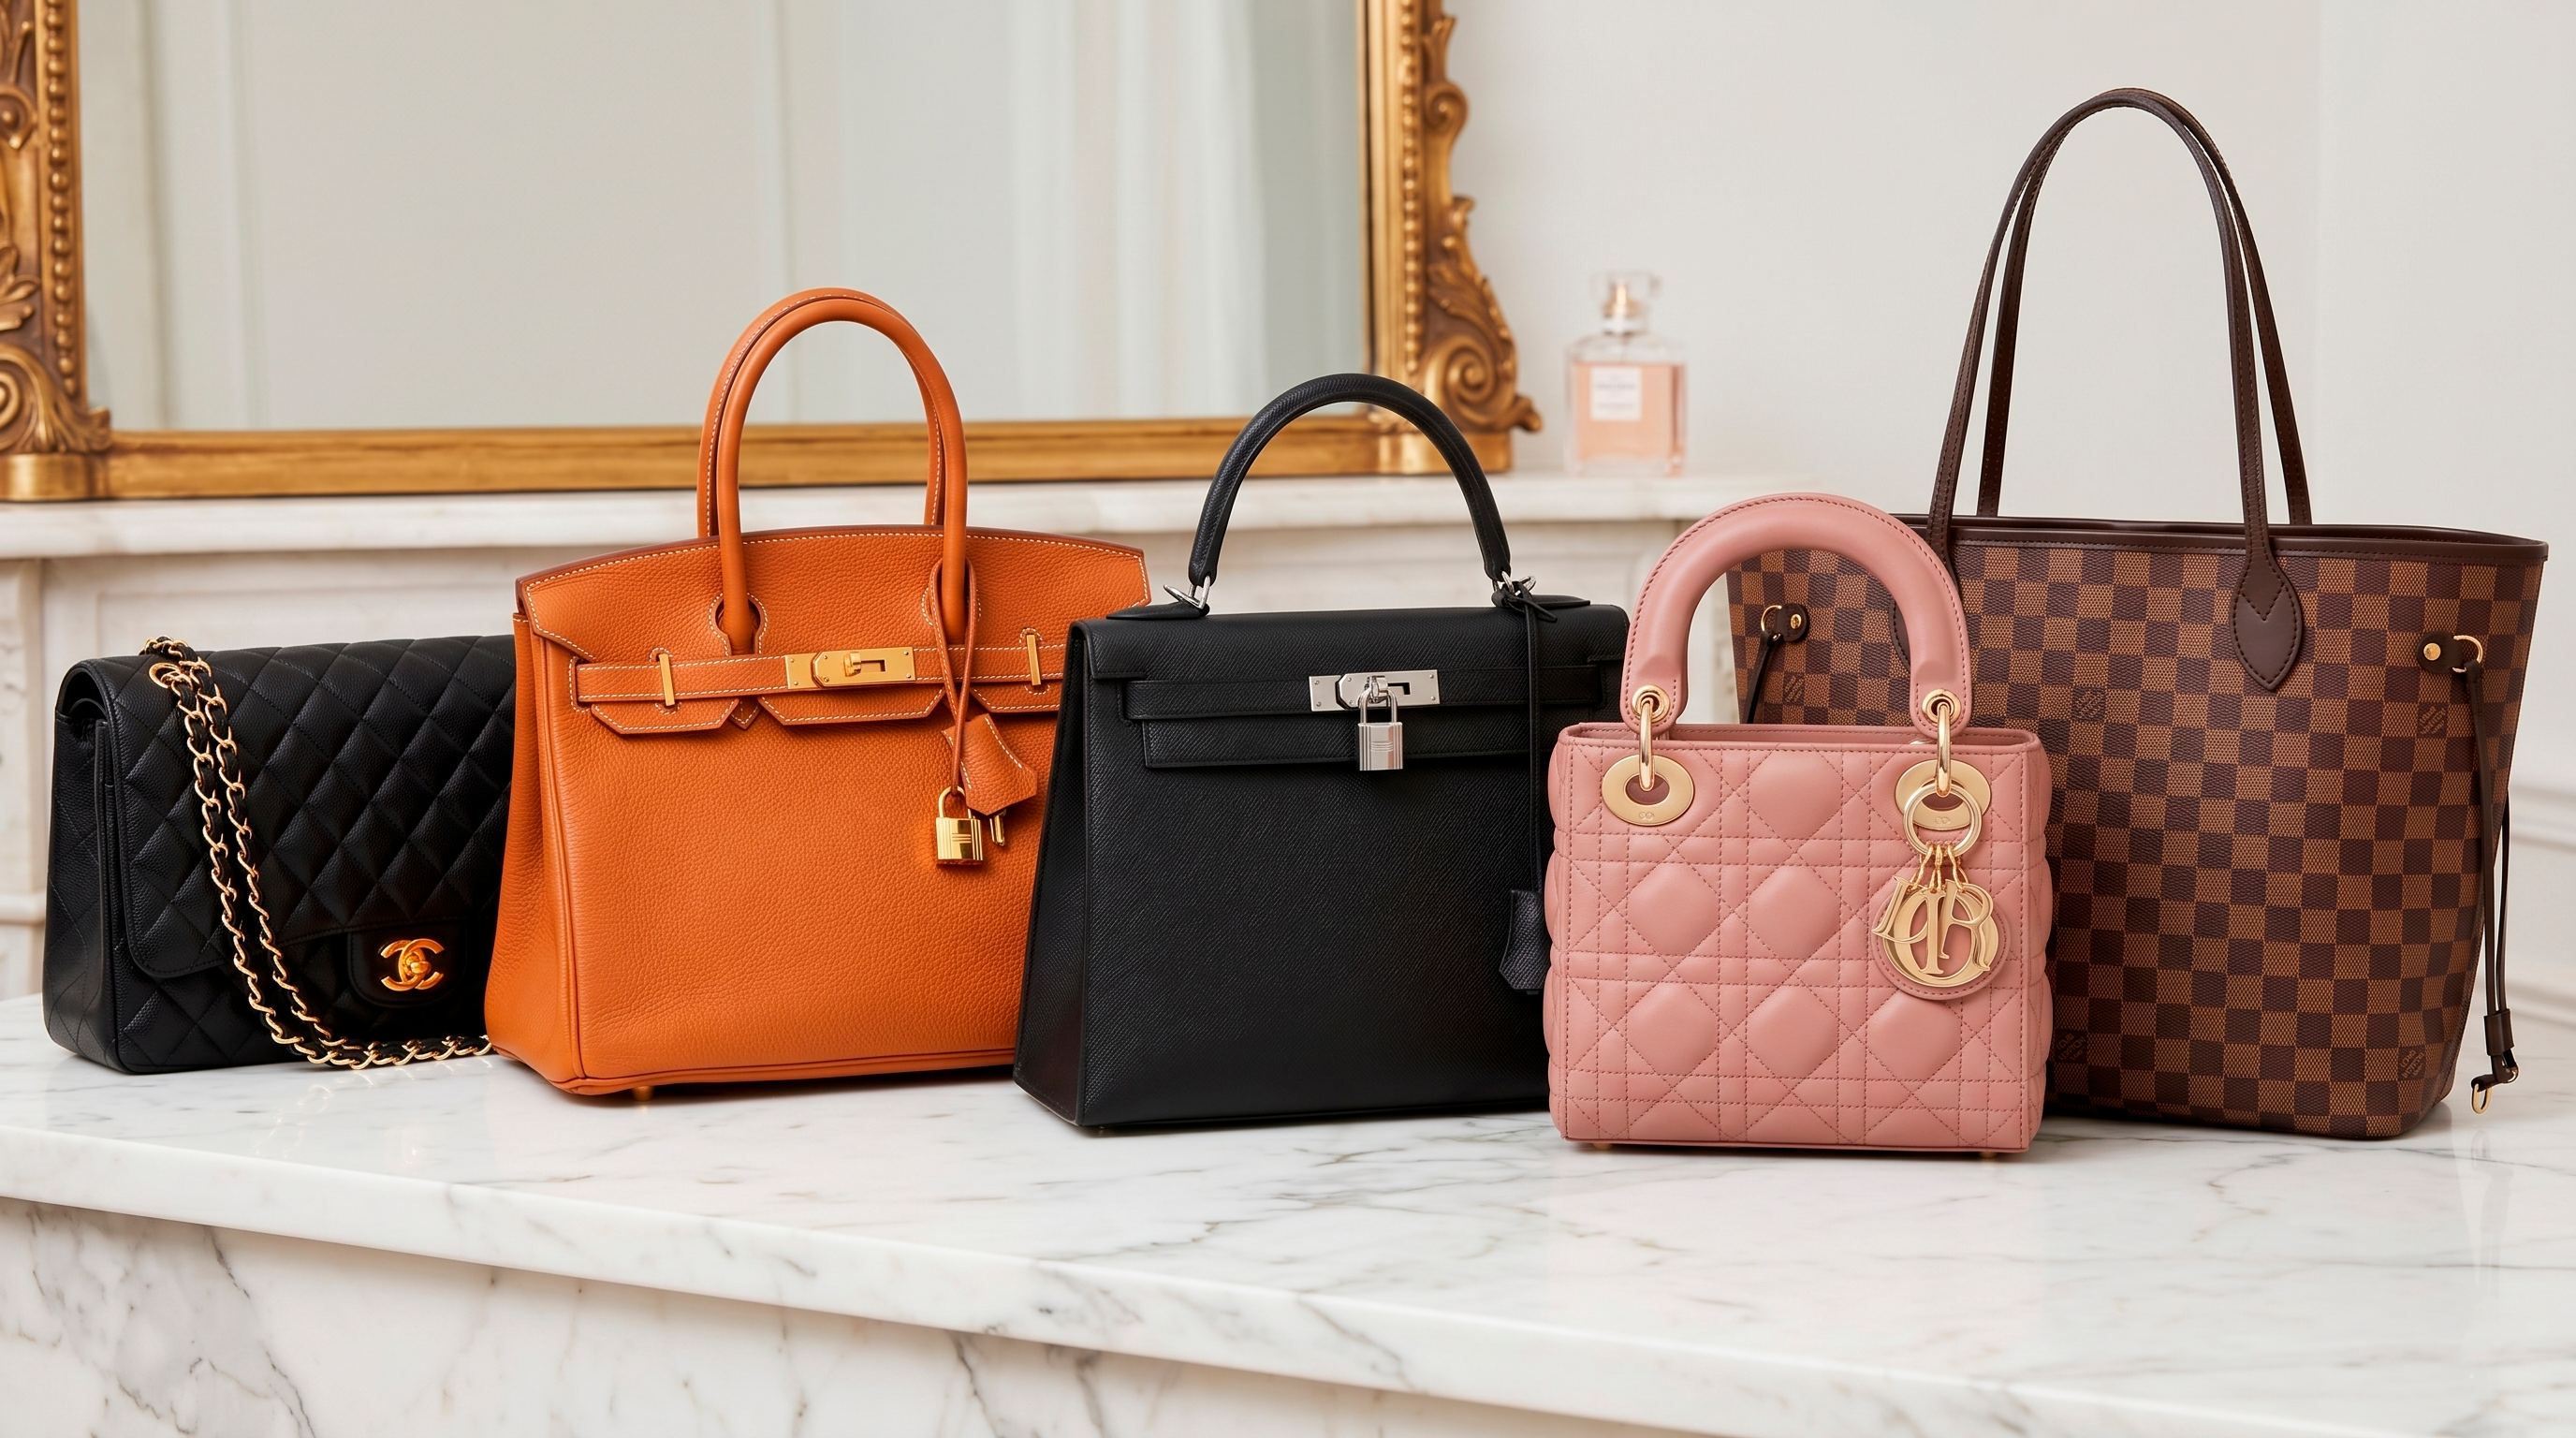
Bitcoin and the Hermès Birkin should not belong in the same sentence.
One is digital, borderless, and traded around the clock. The other is leather, physical, and often difficult to buy even when you have the money. One emerged from cryptographic theory. The other became a cultural symbol through craft, access, and a very particular kind of luxury mystique.
And yet, the comparison works because both are scarcity stories.
What the chart shows
Bitcoin
H. Birkin 30
Bitcoin vs. Birkin: Speculation, Status, and Very Different Kinds of Scarcity
The Splurge Index chart compares Bitcoin with the Hermès Birkin 30 from 2013 to 2026.
Bitcoin is the chaotic line. It surges, crashes, surges again, and turns ordinary percentage language into confetti. The Birkin is far steadier: a long, substantial climb in estimated resale value, shaped by controlled scarcity rather than market-wide mania.
If the question is simply “which generated the larger return?”, Bitcoin’s volatility often dominates the visual. If the question is “which preserved a more stable cultural premium?”, the Birkin becomes much more interesting.
Digital scarcity vs. controlled scarcity
Bitcoin
H. Birkin 30
Bitcoin · 2014
~$387→~$77k
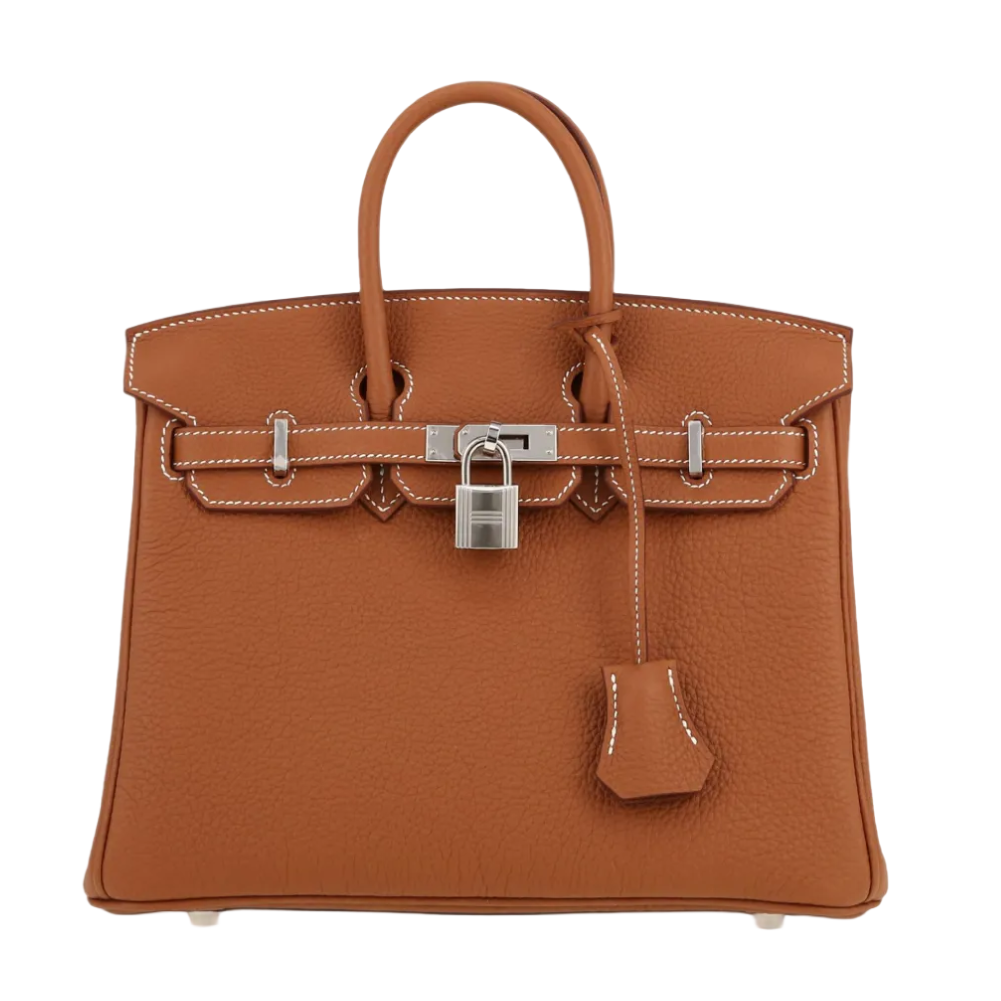
Hermès Birkin · 2013
~$11k→~$25k
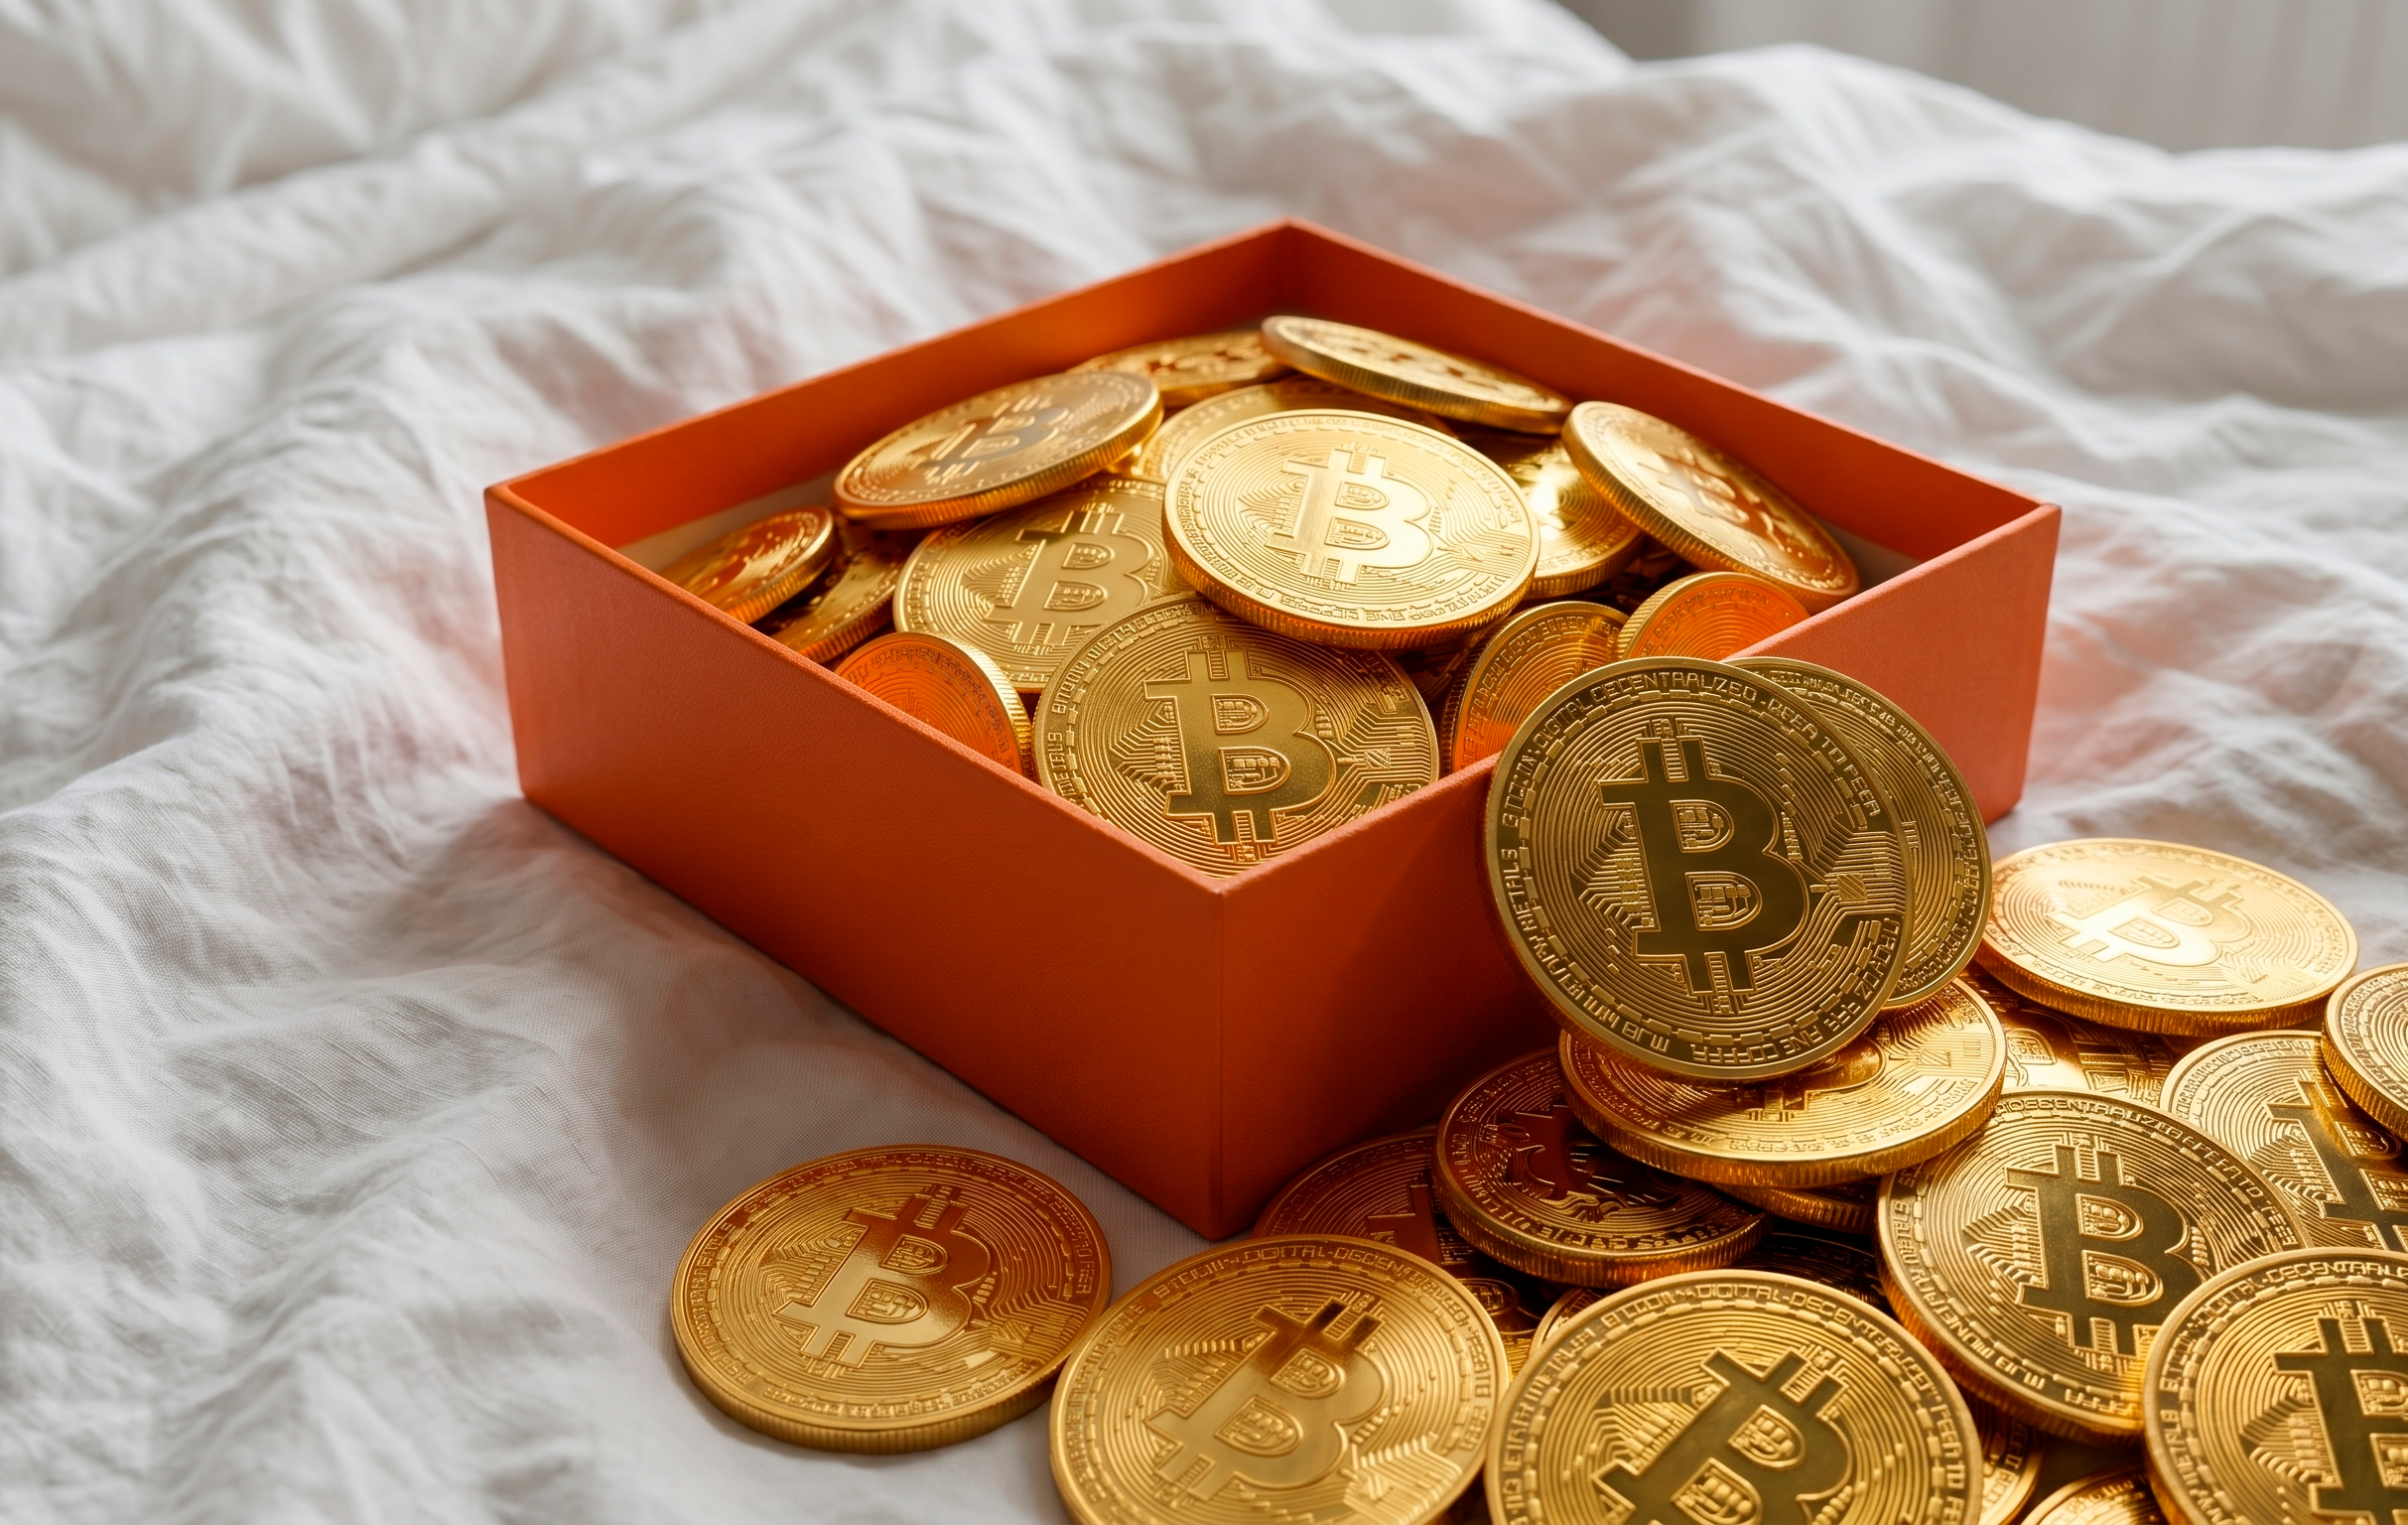
Bitcoin’s scarcity is mathematical. Its supply is capped by protocol design. Its value depends on adoption, belief, regulation, access, macro conditions, and the willingness of people to treat a digital asset as scarce and meaningful.
The Birkin’s scarcity is managed. Hermès controls production, distribution, and access. The object is not infinitely reproducible at the same cultural level because the brand has spent decades making sure it does not become ordinary.
Both systems turn scarcity into desire. But the mechanics are opposite:
Bitcoin is decentralized scarcity.
The Birkin is curated scarcity.
That difference explains a lot about their charts.
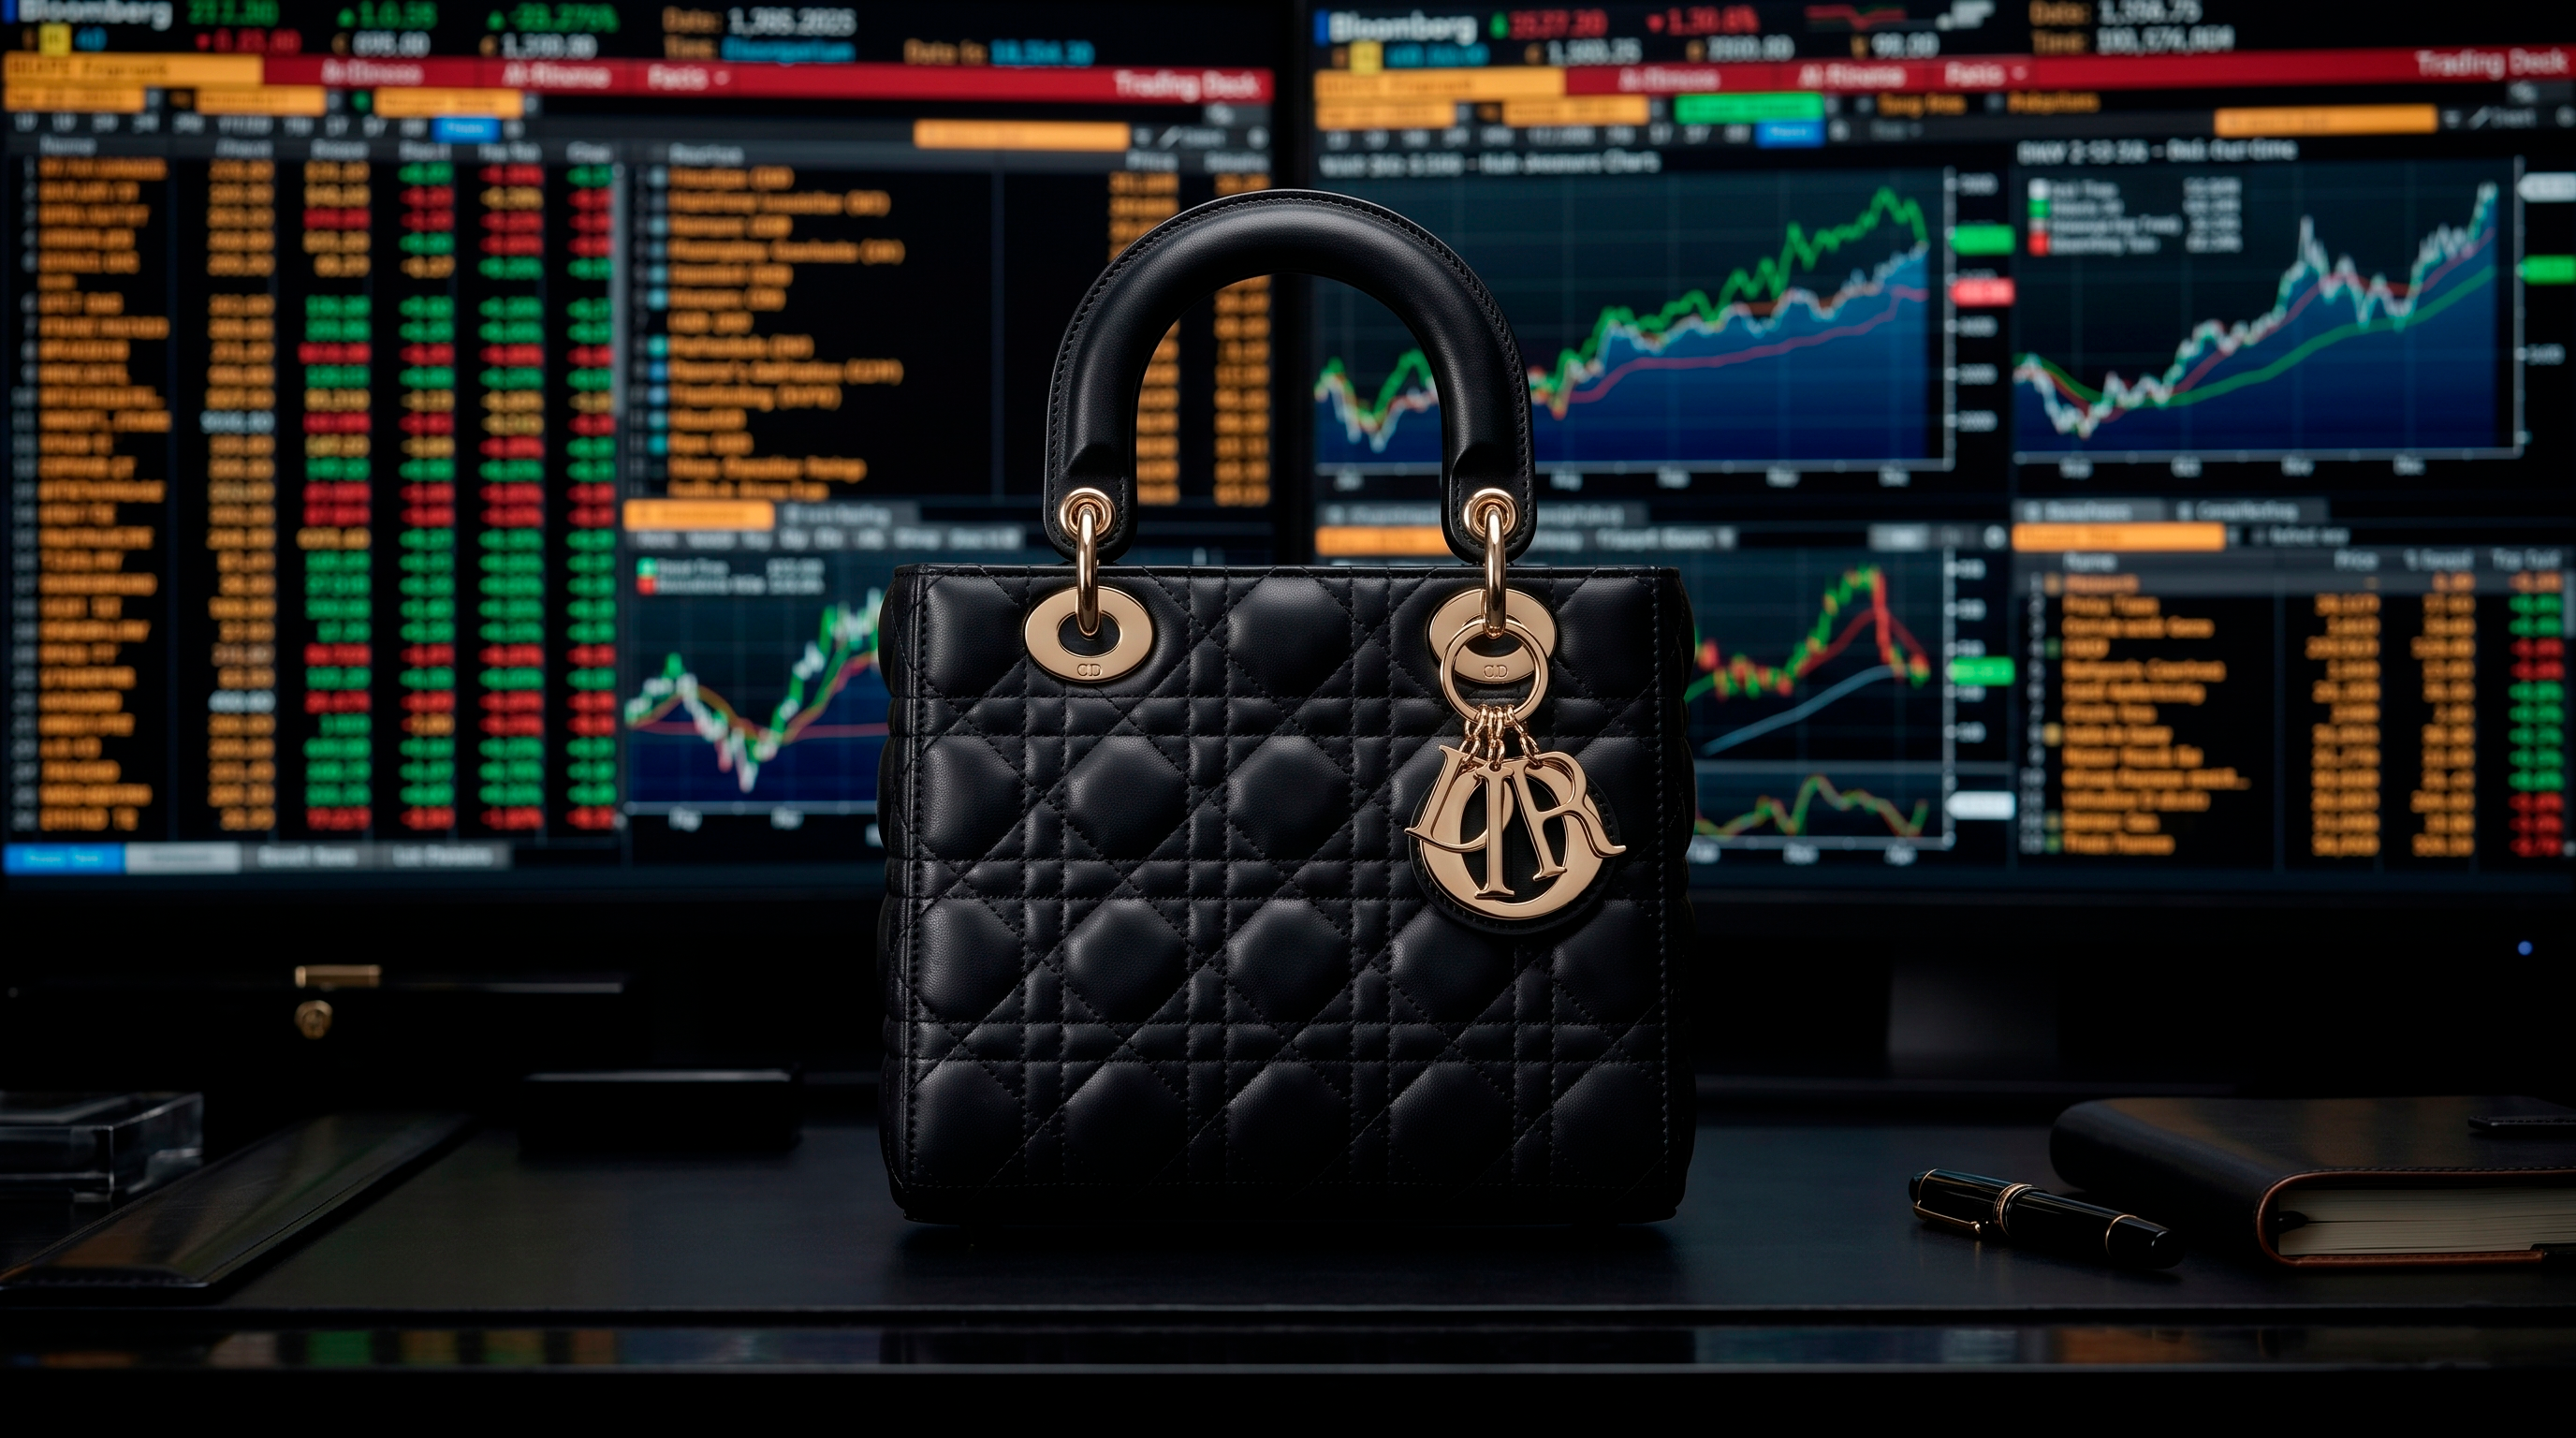
Why Bitcoin feels more explosive
Bitcoin is one of the most volatile major assets of the last decade. It has experienced cycles of exuberance, panic, institutionalization, and renewed demand. The SEC’s 2024 approval of spot Bitcoin exchange-traded products also marked a major shift in market access and legitimacy.
A Birkin will not behave like that. It does not trade 24/7. It does not gap on a regulatory headline. It does not produce a crypto-style bubble and correction within the same weekend.
Its slower movement is not a weakness. It is part of what makes the comparison compelling.
Why the Birkin is still a worthy opponent
The Birkin’s chart is impressive precisely because it is not built on token volatility. It reflects:
retail and resale scarcity,
sustained global demand,
cultural authority,
and a luxury market willing to treat access as a premium.
A bag that more than doubles in estimated resale value across the period does not need to imitate Bitcoin to become noteworthy. It is noteworthy because it achieves a serious price arc through an entirely different value system.
What both assets have in common
This is the uncomfortable part: people often buy both for reasons that are not purely rational.
Bitcoin can be ideological, speculative, tribal, or status-coded. The Birkin can be aesthetic, social, aspirational, or status-coded. Both attract communities that defend their logic with unusual intensity. Both create stories around access. Both turn ownership into a signal.
That does not make them the same. It explains why comparing them feels less absurd the longer you stare at the chart.
The takeaway
Bitcoin and the Birkin are not substitutes. They are not even close.
But they do reveal two powerful ways scarcity becomes price:
one through code,
one through culture.
The chart does not flatten those differences. It puts them under better lighting.