Birkin vs. the S&P 500: Did the Iconic Bag Actually Win?
The Birkin has become the luxury asset cliché for a reason. The chart is impressive. The comparison is still messier than the headline.
The Birkin has become the go-to example whenever someone wants to say that luxury can beat the market. It is the handbag people compare with gold, stocks, and whatever else is having a culturally convenient moment.
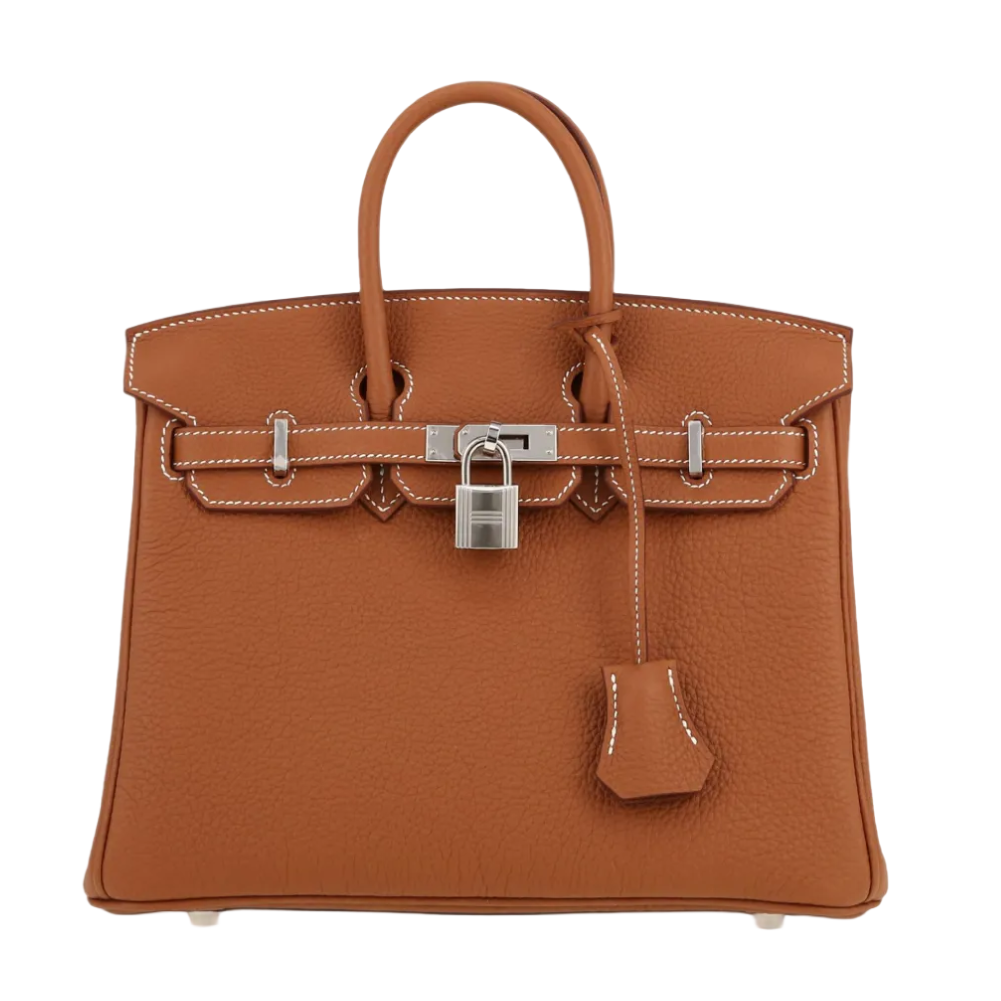
There is a reason the comparison survives. In The Splurge Index series, the Hermès Birkin 30 rises from roughly $11,000 in 2013 to $25,000 in 2026. That is not a polite little resale bump. It is a serious price story.
But once the Birkin steps into the ring with the S&P 500, the question becomes more interesting than “who won?”
What the chart is really comparing
H. Birkin 30
S&P 500
Birkin vs. the S&P 500: Did the Iconic Bag Actually Win?
The chart places the Birkin 30 against SPY, a widely used ETF that tracks the S&P 500. One curve represents the estimated resale price of a highly sought-after luxury object. The other represents a liquid, diversified equity benchmark.
That difference matters. The chart is useful because it lets us compare historical price performance over the same period. It does not magically turn a handbag and an index fund into equivalent financial tools.
Still, the visual is irresistible. The Birkin’s rise is not a blip. It reflects years of scarcity, controlled access, prestige reinforcement, and a secondary market willing to pay for all three.
Why the Birkin became the luxury benchmark
H. Birkin 30
S&P 500
Hermès Birkin · 2016
~$14k→~$25k
S&P 500 · 2016
~$185→~$734
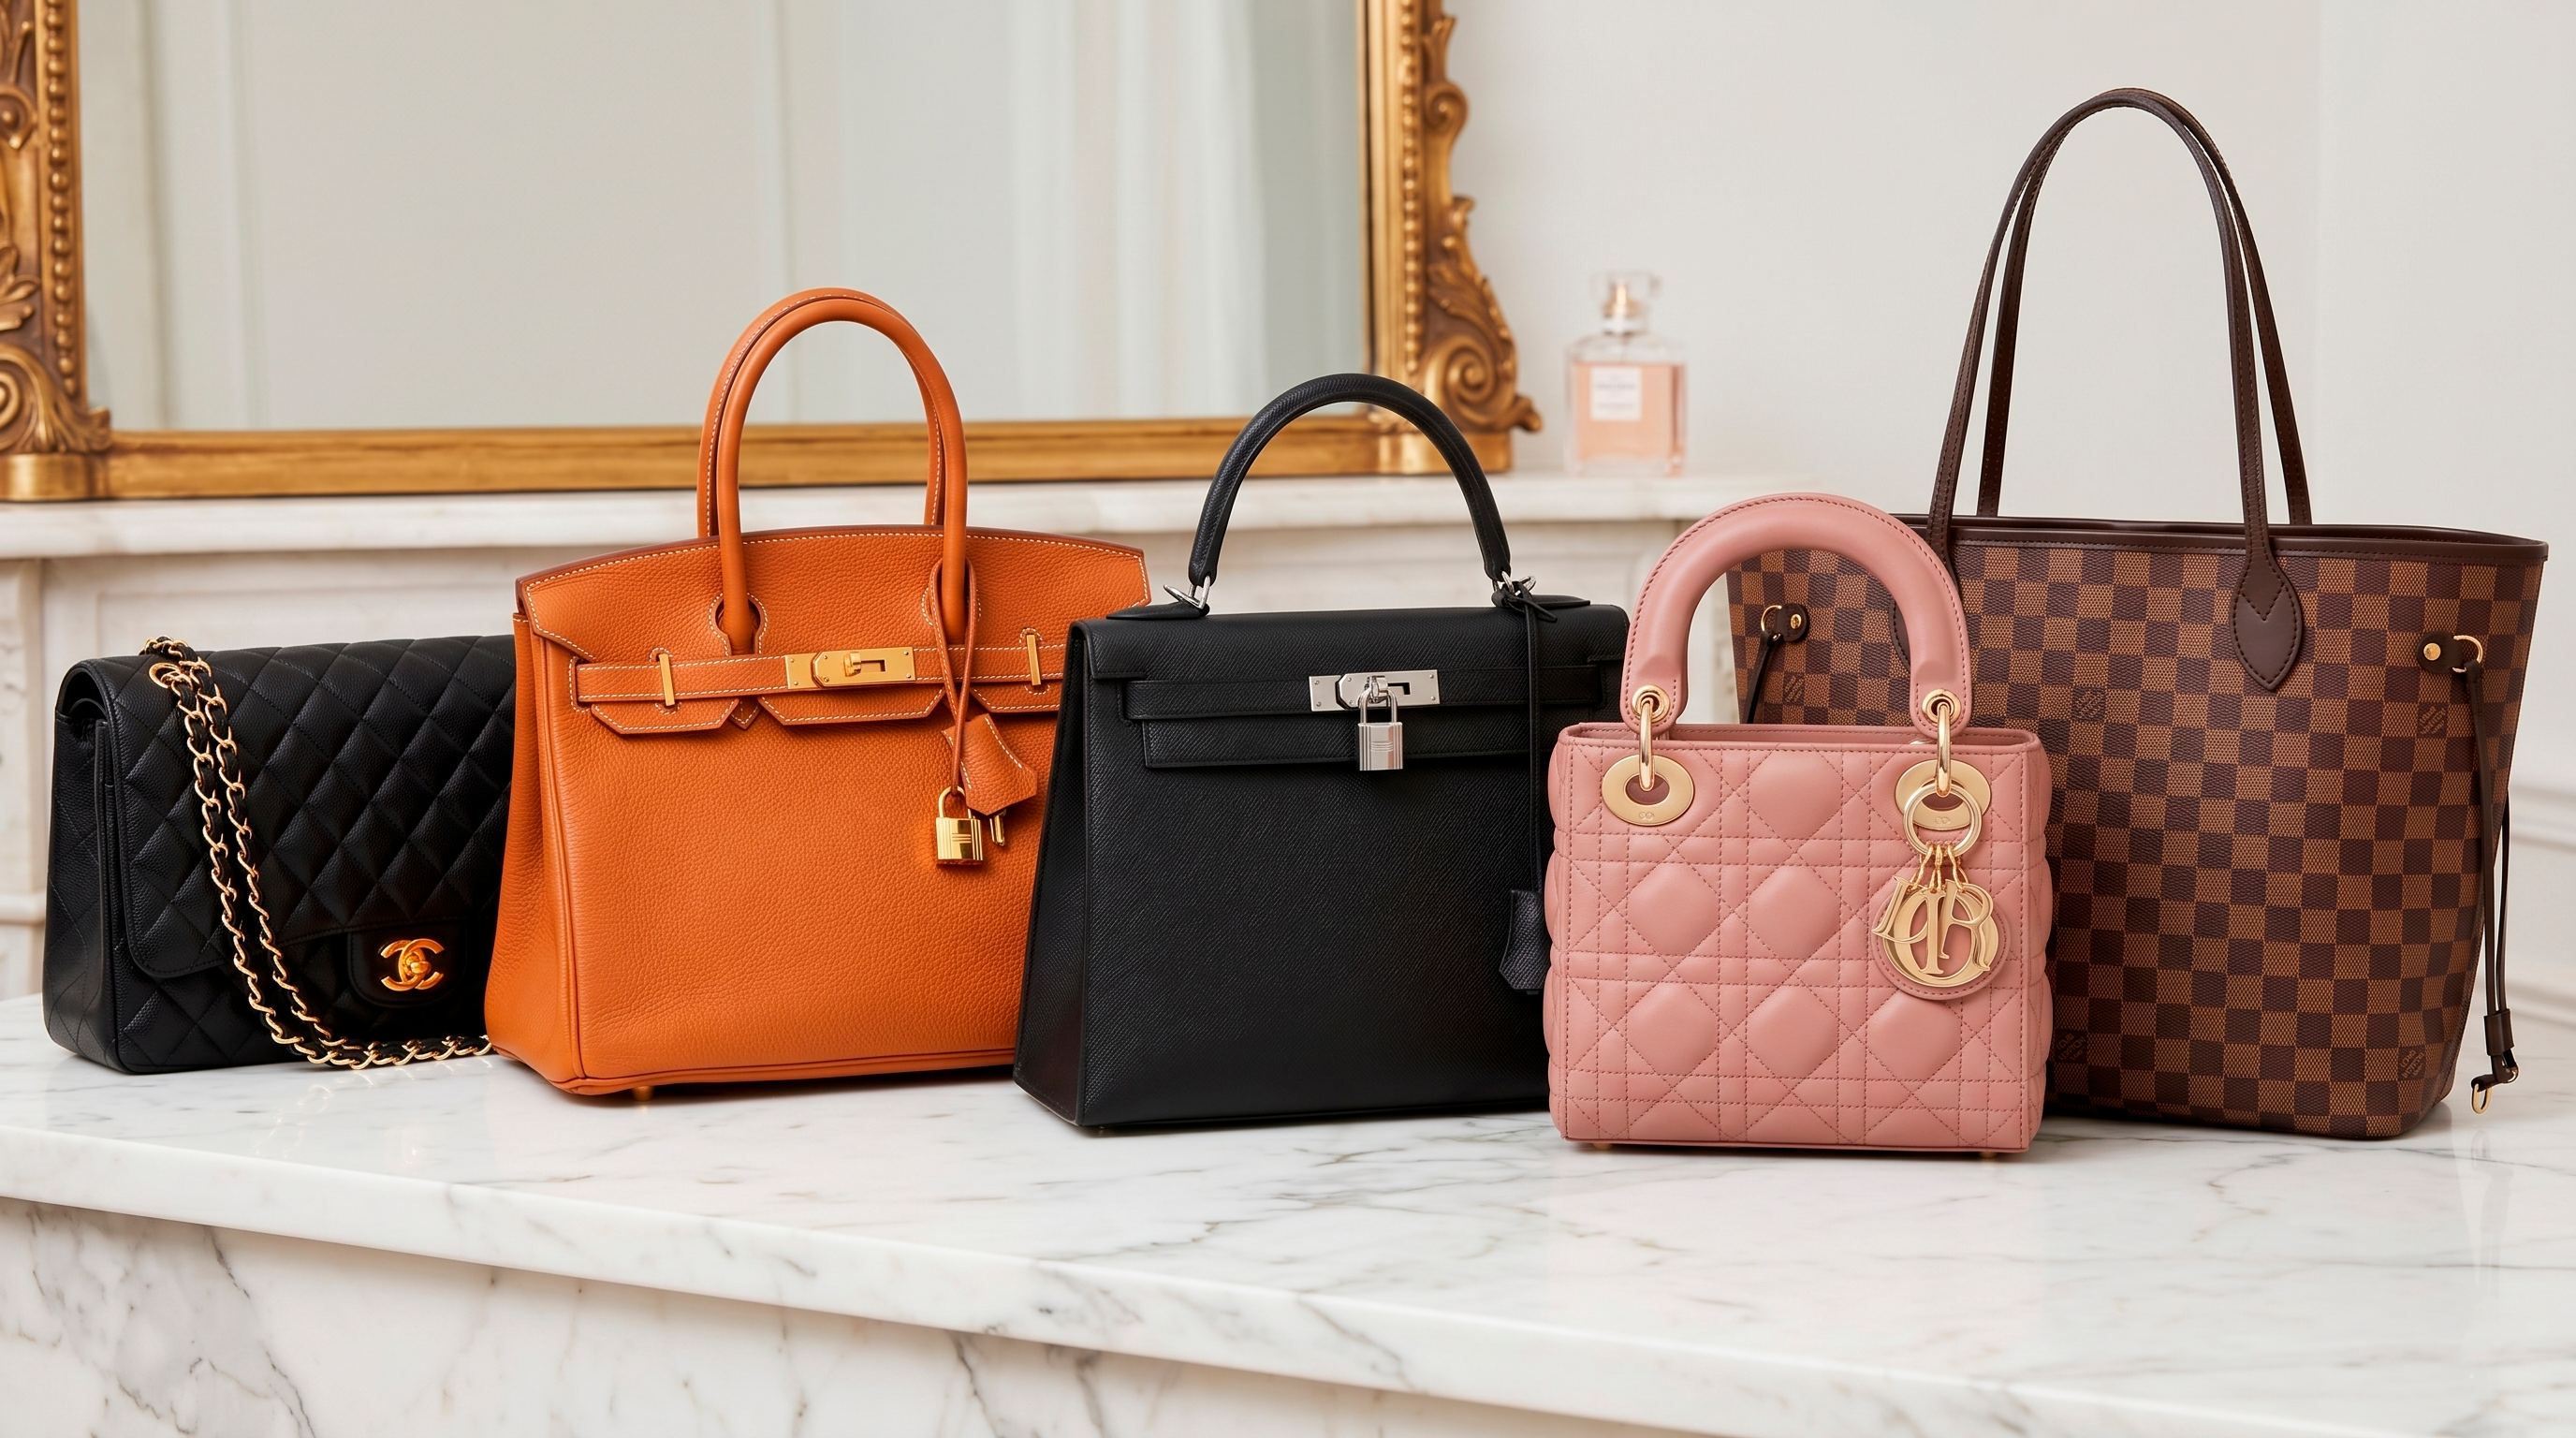
A lot of luxury objects are expensive. Far fewer become structurally difficult to obtain.
The Birkin’s value story is not just that it is iconic. It is that access itself is part of the product. Hermès tightly manages supply. The bags are handcrafted, production is constrained, and boutique availability is famously selective. That creates a market where demand can remain strong even as retail and resale prices climb.
On the secondary market, the outcome is unusually visible. Sotheby’s notes that Birkin pricing is influenced by condition, size, material, color, and date stamp, which means the “Birkin market” is not one uniform thing. But at the category level, the premium around the most desirable examples has remained one of luxury’s defining resale stories.
Why the S&P 500 is still a serious opponent
If the Birkin is scarcity with handles, the S&P 500 is compounding with a compliance department.
SPY represents exposure to hundreds of large U.S. companies. It is liquid. It is easy to buy or sell. It can be rebalanced, fractionally owned, and paired with dividends depending on how returns are measured. It has none of the romance of a Birkin, which may be exactly the point.
The chart makes a cultural comparison. But the underlying assets carry wildly different assumptions about:
liquidity,
transaction friction,
diversification,
storage,
use value,
and risk.
A Birkin can hold resale value spectacularly well and still be much less practical as a financial instrument than a public-market ETF.
The “beat the market” headline is both fun and incomplete
This is where the internet tends to flatten the story.
If a Birkin’s resale value grows faster than an index over a selected window, that is a legitimate historical observation. It is also the kind of observation that gets turned into a smug headline: *you should have bought the bag*.
But that headline leaves a lot out.
A bag may require authentication, consignment, negotiation, and selling fees. Its value can change dramatically with condition, leather, hardware, color, and demand for a specific configuration. The S&P 500 does not care whether you scuffed it in an airport lounge.
The Birkin wins attention because it violates expectations. The market benchmark wins credibility because it behaves like an actual market benchmark.
So did the Birkin win?
The better answer is: the Birkin earned the comparison.
It has shown enough historical resale-price strength that putting it next to the S&P 500 is not just a joke. It is a useful way to understand how luxury scarcity can become financially legible.
But if the question is whether a Birkin is “better” than the S&P 500, the chart cannot settle that alone. One is an investable index proxy. The other is an illiquid, high-status consumer object with a remarkable resale history.
They are not the same kind of winner.
The takeaway
The Birkin’s performance is exactly why The Splurge Index exists. It is absurd enough to be interesting and real enough to deserve a chart.
From 2013 to 2026, the Birkin 30’s resale-price path shows that certain luxury goods can behave like serious price assets. The S&P 500 comparison keeps the conversation honest: price appreciation is not the same thing as investment equivalence.